Are Nebula Colors Literal?

Finnegan Flynn
| 06-09-2026
 · Science Team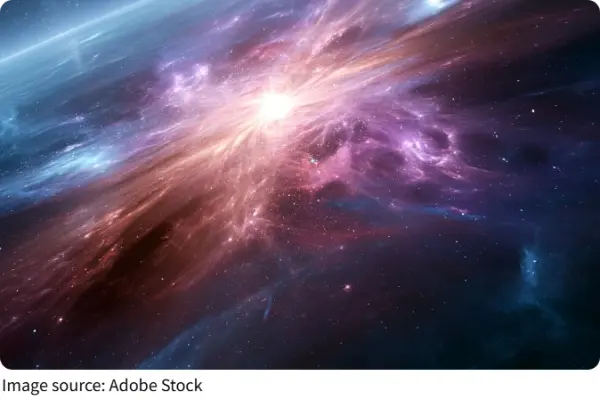
Hello, readers, and welcome. Nebula colors become easier to interpret when you separate recorded wavelengths from the hues chosen for a finished image. A telescope detector begins by counting light through selected filters, often producing several grayscale exposures rather than one ready-made color view.
Image processors then assign visible hues to those measurements and combine them so separate structures can be compared. The result can preserve real wavelength information without matching what unaided human vision would see.
Light Before Color
A nebula is a cloud of gas and dust whose appearance depends on its source of illumination and its physical state. Some clouds glow because nearby hot stars supply enough energy to excite or ionize their atoms. Others mainly reflect starlight from surrounding material, while dark clouds block background light. These processes produce different spectra, so color is evidence that requires interpretation rather than a direct chemical label. The same cloud can appear different in separate bands even though the material itself has not changed.
Human eyes and electronic detectors also respond differently. A long camera exposure can collect faint visible light for far longer than an eye can, revealing emission too weak to notice at a telescope. Other instruments record ultraviolet or infrared wavelengths outside human vision. When those measurements are assigned visible hues, the colors provide an organized display of data rather than a simulation of ordinary sight. Detector sensitivity, exposure length, and intensity scaling also determine which faint structures become visible.
Why Gas Produces Lines
Atoms and ions contain electrons that can occupy particular energy levels. Radiation or collisions can move an electron to a higher level, and the electron releases a photon at a specific wavelength when it returns to a lower one. Each element has a characteristic set of allowed transitions. A glowing cloud therefore produces emission lines that can identify hydrogen, oxygen, nitrogen, sulfur, and other constituents.
Line brightness carries more information than presence alone, but it does not give a simple inventory by itself. The signal also depends on gas temperature, density, ionization state, incoming radiation, and the probability of a transition. Dust can weaken some wavelengths more than others, and overlapping lines may require careful separation. Astronomers compare several lines and use physical models before estimating chemical abundances or local conditions. A stronger line may reflect excitation conditions rather than a larger total quantity of the element.
How Filters Build Images
A narrowband filter admits a small wavelength range centered on a selected emission line. One exposure might record hydrogen emission, while another isolates light from ionized oxygen and a third samples sulfur. Each exposure starts as measured intensity across a grid of pixels. Assigning a different display hue to each layer makes regions with stronger or weaker emission easier to distinguish in the combined image.
The chosen palette is not universal. Oxygen may appear blue in one published composite and another hue in a different processing scheme, depending on the available filters and the purpose of the comparison. Mixed hues appear where two or more layers are bright in the same pixels. A color key and filter list are therefore more informative than assumptions based on familiar color associations. Processing may also balance bright and faint structures so one intense region does not hide weaker detail elsewhere.
Reading Color With Care
Begin by checking whether an astronomical picture is described as natural color, representative color, or a multiwavelength composite. Natural-color processing attempts to approximate visible perception, although exposure and display adjustments still affect the result. Representative color maps recorded bands into a clear palette, while multiwavelength views may combine visible, infrared, ultraviolet, radio, or X-ray measurements. These approaches answer different questions. A processing note should state which method was used.
Then connect each hue to its stated wavelength before drawing conclusions about chemistry. Bright blue, for example, identifies oxygen emission when the color key assigns oxygen data to blue. Compare the shapes and locations of colored regions: they can reveal ionized zones near energetic stars, cooler or denser boundaries, dust-obscured areas, and shocked gas. Spectroscopy confirms composition by measuring detailed line positions and intensities.
Nebula imagery joins measurement with deliberate display choices, so vivid color can be scientifically useful without being literal. Reading the filter key, wavelength range, and processing description turns an attractive picture into a clearer account of the cloud's composition and physical conditions.